- Delhi
- Last Update 07:48: am

Data Science vs. Data Analytics: What’s the Difference?
In the world of information technology, two terms that often get thrown around interchangeably are "Data Science" and "Data Analytics." While they share some similarities, they are distinct disciplines with unique focuses and applications. Understanding the differences between these two fields is crucial for businesses and professionals looking to harness the power of data effectively.
Understanding Data Science
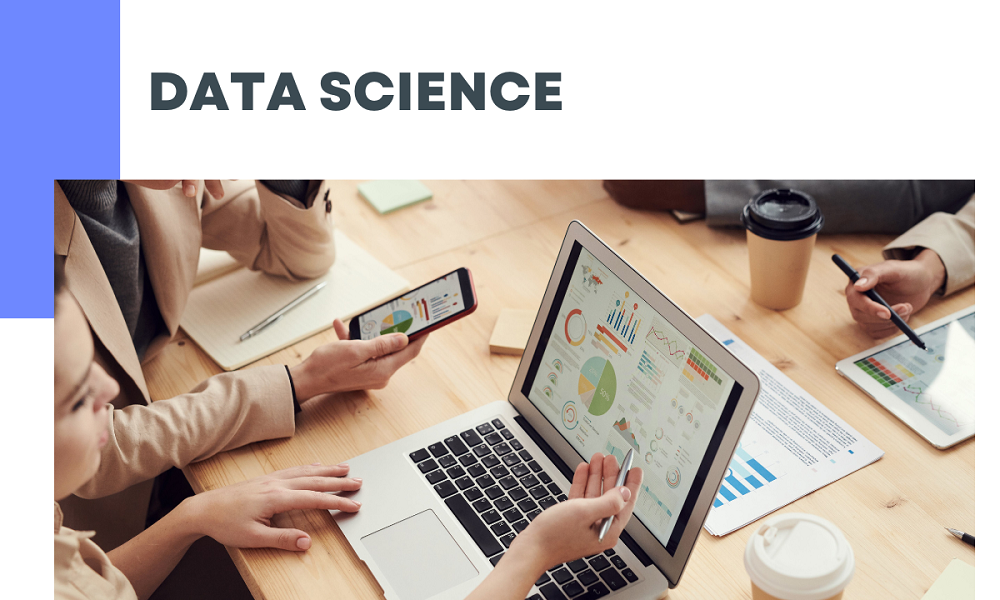
The multidisciplinary discipline of data science draws knowledge and insights from both structured and unstructured data using scientific procedures, systems, algorithms, and processes. To find patterns, trends, and correlations within datasets, it combines aspects of computer science, statistics, domain expertise, mathematics, and data visualization.
Data scientists are tasked with gathering, cleaning, analyzing, and interpreting vast amounts of data to derive actionable insights and solve complex problems. They often work with large datasets using advanced analytical techniques such as machine learning, predictive modeling, and artificial intelligence to uncover hidden patterns and make data-driven decisions.
Data Science is employed across various industries, including finance, healthcare, e-commerce, and marketing, to optimize processes, improve decision-making, and drive innovation.

Data Science Process
The Data Science process is a systematic approach used by data scientists to extract insights and valuable information from data. It involves several key steps that help in understanding, analyzing, and deriving actionable insights from datasets. Here is an overview of the Data Science process:
Problem Definition: The first step in the Data Science process is to clearly define the problem or objective that needs to be addressed. This involves understanding the business context, defining goals, and determining what insights or solutions are required from the data.
Data Collection: Once the problem is defined, data scientists gather relevant data from various sources. This could include structured data from databases, unstructured data from text documents or social media, or semi-structured data from APIs or web scraping.
Data Preparation: Data collected from different sources often requires cleaning and preprocessing before analysis. This step involves removing duplicates, handling missing values, and transforming the data into a format suitable for analysis. Data preprocessing also includes feature engineering, where new features are created or existing features are modified to improve model performance.
Exploratory Data Analysis (EDA): EDA entails examining the dataset to comprehend its properties, spot trends, and determine how the variables relate to one another. During EDA, data distributions, correlations, and outliers are frequently visualized using data visualization techniques like scatter plots, heatmaps, and histograms.
Model Development: In this step, data scientists select appropriate machine learning algorithms or statistical models based on the nature of the problem and the characteristics of the data. Models are trained using historical data to learn patterns and relationships that can be used to make predictions or generate insights.
Model Evaluation: Once models are trained, they are evaluated using performance metrics such as accuracy, precision, recall, and F1-score. Model evaluation helps assess how well the model generalizes to new, unseen data and whether it meets the requirements of the problem definition.
Model Deployment: After successful evaluation, models are deployed into production environments where they can be used to make predictions or generate insights in real-time. Model deployment involves integrating the model into existing systems and monitoring its performance over time.
Monitoring and Maintenance: Once deployed, models need to be monitored and maintained to ensure they continue to perform accurately and reliably. This involves monitoring model inputs and outputs, retraining models periodically with new data, and updating models to adapt to changing business requirements or data distributions.
Documentation and Communication: Throughout the Data Science process, it's important to document all steps, methodologies, and decisions made. Clear documentation helps in replicating results, sharing insights with stakeholders, and facilitating collaboration among team members.
Exploring Data Analytics
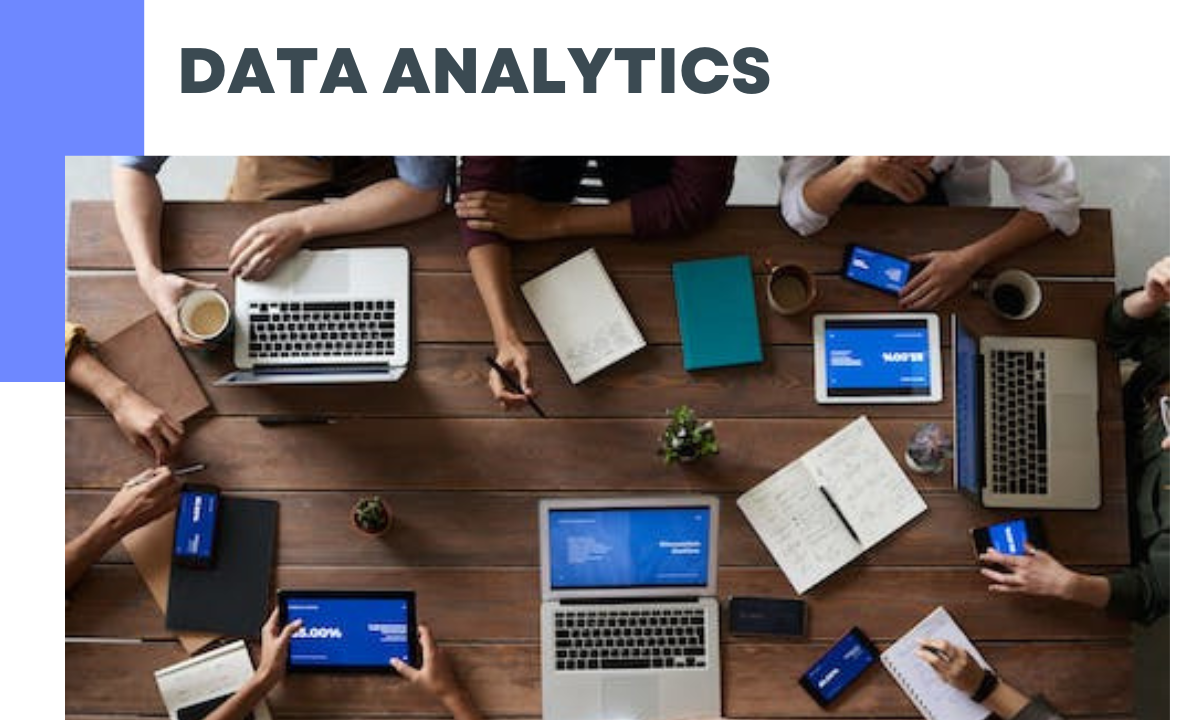
Data Analytics, on the other hand, focuses on analyzing data to uncover meaningful insights, trends, and patterns that can inform business decisions and strategies. It involves the exploration, interpretation, and visualization of data using statistical and analytical tools to identify trends, correlations, and outliers.
Data analysts are responsible for examining datasets to extract valuable insights and provide recommendations based on their findings. They use techniques such as descriptive statistics, data mining, and data visualization to communicate their findings effectively to stakeholders and decision-makers.
Data Analytics plays a vital role in helping organizations understand customer behavior, optimize operations, and gain a competitive edge in the market. It provides valuable insights into market trends, customer preferences, and operational efficiency, enabling businesses to make informed decisions and drive growth.

Data Analytics Process
The Data Analytics process is a systematic approach used to analyze and interpret data to uncover insights, patterns, and trends that inform decision-making and drive business outcomes. Here is an overview of the Data Analytics process:
Define Objectives: The first step in the Data Analytics process is to clearly define the objectives and questions that need to be answered through data analysis. Understanding the business context and stakeholders' requirements is essential for setting meaningful goals.
Data Collection: Once objectives are defined, relevant data is collected from various sources, including databases, spreadsheets, APIs, and external datasets. Data may be structured, semi-structured, or unstructured, depending on its format and source.
Data Preparation: Data collected from different sources often requires cleaning, preprocessing, and transformation to ensure its quality and usability for analysis. This involves tasks such as removing duplicates, handling missing values, and standardizing data formats.
Data Exploration: In this step, data analysts explore the dataset to understand its characteristics, distributions, and relationships between variables. Exploratory data analysis techniques such as summary statistics, histograms, and scatter plots are used to gain insights into the data.
Data Analysis: Data analysts apply statistical and analytical techniques to analyze the dataset and answer the predefined questions or hypotheses. This may involve conducting descriptive statistics, performing hypothesis testing, and applying machine learning algorithms for predictive modeling or classification tasks.
Data Visualization: Data visualization plays a crucial role in Data Analytics for presenting insights and findings in a clear and understandable format. Visualization techniques such as charts, graphs, and dashboards help stakeholders visualize trends, patterns, and outliers within the data.
Interpretation and Insights: Once the analysis is complete, data analysts interpret the results and derive actionable insights that address the objectives defined at the beginning of the process. Insights may include recommendations for optimizing processes, identifying opportunities, or mitigating risks based on the analysis.
Communication and Reporting: The final step in the Data Analytics process involves communicating the findings and insights to stakeholders through reports, presentations, or interactive dashboards. Clear and concise communication is essential for ensuring that stakeholders understand the implications of the analysis and can make informed decisions based on the insights.
Iterative Process: Data Analytics is often an iterative process, where insights from initial analyses may lead to further questions or refinements in the analysis approach. Data analysts continuously refine their methods and iterate on the analysis to uncover deeper insights and address evolving business needs
Data Science vs Data Analytics
Data Science and Data Analytics are two closely related fields that involve working with data to extract insights and make informed decisions. While they share similarities, they have distinct focuses and applications:
Data Science:
Scope: Data Science is a multidisciplinary field that encompasses various aspects of data analysis, including data collection, cleaning, analysis, and interpretation. It involves using advanced algorithms, statistical methods, and machine learning techniques to extract insights and knowledge from large and complex datasets.
Objective: The primary objective of Data Science is to uncover patterns, trends, and correlations within data to derive actionable insights and make predictions about future outcomes. Data scientists often work on projects that involve building predictive models, developing algorithms, and solving complex problems using data-driven approaches.
Techniques: Data Science employs a wide range of techniques, including machine learning, natural language processing, and data mining, to analyze and interpret data. Data scientists use programming languages such as Python and R, along with libraries like NumPy, Pandas, and Scikit-learn, to manipulate and analyze datasets.
Data Analytics:
Scope: The goal of data analytics is to examine data in order to find significant trends, patterns, and insights that can guide company strategy and decision-making. In order to find practical insights, it entails analyzing, interpreting, and visualizing data utilizing statistical and analytical methods.
Objective: The primary objective of Data Analytics is to provide descriptive insights and support strategic decision-making within organizations. Data analysts often work with stakeholders to understand business requirements, define key performance indicators (KPIs), and generate reports or dashboards that help stakeholders understand trends and make data-driven decisions.
Techniques: Data Analytics involves using statistical analysis, data visualization, and exploratory data analysis techniques to explore and interpret data. Data analysts use tools such as Excel, Tableau, and Power BI to create visualizations, perform ad-hoc analysis, and communicate insights to stakeholders.


