- Delhi
- Last Update 11:14: pm

What Are the Top 10 Essential Excel Features for Data Analysts?
The top 10 essential Excel features for data analysts are:
Data analysts rely heavily on Excel to manipulate, analyze, and interpret data. With a vast array of features, mastering the most efficient tools can significantly enhance your workflow. Here, we delve into the top 10 essential Excel features every data analyst should have in their toolkit:
- Pivot tables and pivot charts
- Conditional formatting
- Remove duplicates
- XLOOKUP
- IFERROR
- MATCH
- COUNTBLANK
- DAYS and NETWORKDAYS
- RANK
- SUMPRODUCT
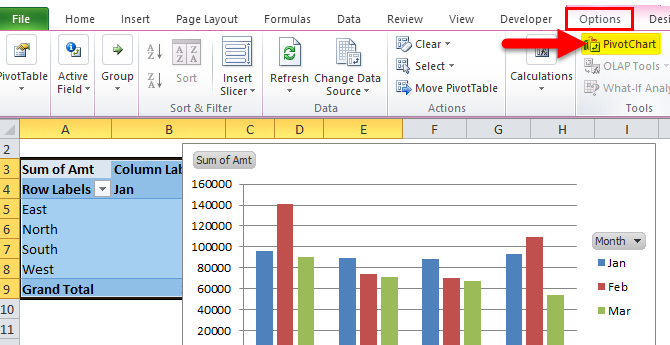
Pivot tables and pivot charts
Pivot tables and pivot charts are essential tools in Excel for data analysis and visualization. Pivot tables enable users to summarize and analyze large datasets by rearranging and summarizing data dynamically. Pivot charts complement pivot tables by providing visual representations of the summarized data, making it easier to interpret trends and patterns. Together, they offer a powerful way to gain insights from data and present findings clearly and concisely.
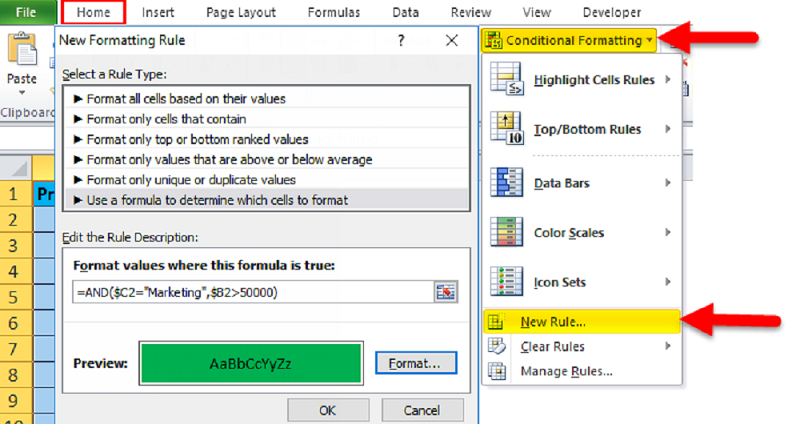
Conditional formatting
Conditional formatting in Excel is a feature that allows users to format cells based on specific criteria or conditions. With conditional formatting, users can highlight data points, cells, or ranges that meet certain rules, making it easier to identify trends, outliers, or important information within a dataset.
Users can apply various formatting options such as colour, font style, and borders to cells based on conditions like values, text, dates, or formulas. This dynamic feature enhances data visualization and analysis, enabling users to quickly spot patterns, discrepancies, or areas of interest in their Excel spreadsheets.
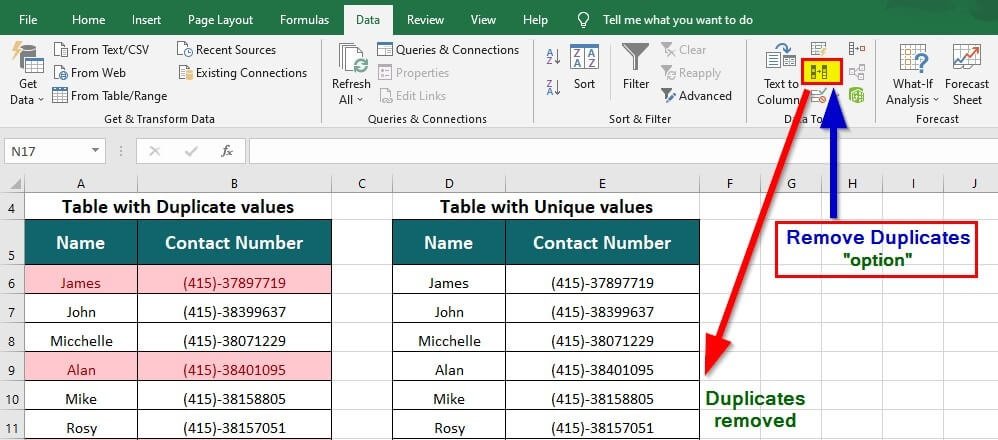
Remove duplicates
In Excel, removing duplicates entails eliminating redundant entries within a dataset. This process helps streamline data clarity and analysis by retaining unique values. To accomplish this, users navigate to the "Data" tab, select "Remove Duplicates," and then specify the columns containing potential duplicates. Excel compares selected columns and removes identical rows, leaving behind only distinct entries. This feature is invaluable for maintaining data integrity, especially in large datasets, ensuring accuracy and efficiency in subsequent analysis and reporting tasks. Removing duplicates enhances data reliability and simplifies interpretation, supporting effective decision-making processes.
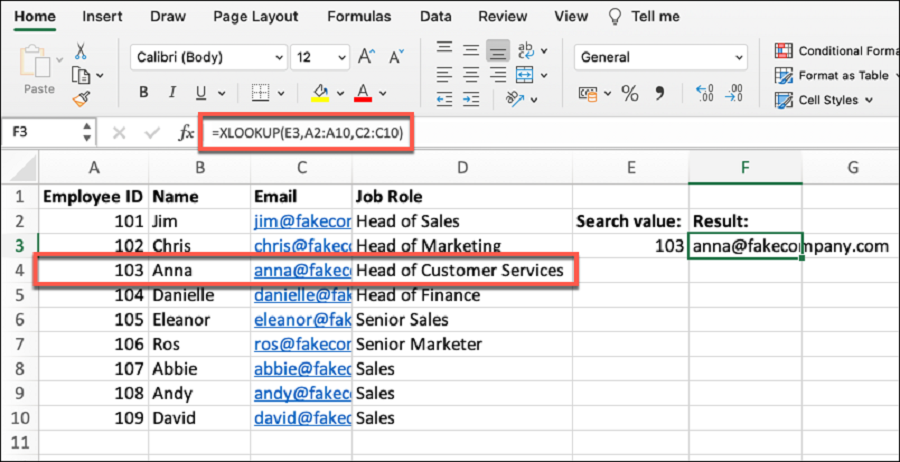
XLOOKUP
XLOOKUP is a powerful function in Excel designed to search for and retrieve data from a range or array. It offers enhanced capabilities compared to its predecessors like VLOOKUP and HLOOKUP. With XLOOKUP, users can search for a value in one column or row (the lookup array), and return a corresponding value from the same position in another column or row (the return array). This function supports both vertical and horizontal searches, making it highly versatile. Additionally, XLOOKUP allows for approximate and exact matching, as well as handling errors and providing default return values when a match is not found. Its syntax is straightforward, making it accessible to users of varying proficiency levels. XLOOKUP simplifies data retrieval tasks, streamlining workflows and improving efficiency in data analysis, reporting, and decision-making processes within Excel.
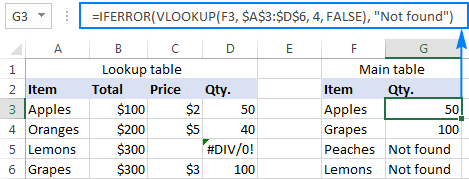
IFERROR
The IFERROR function in Excel allows users to handle errors gracefully by specifying an alternate value or action if a formula results in an error. It checks whether a formula returns an error value and returns a specified result if true, otherwise, it returns the result of the formula.
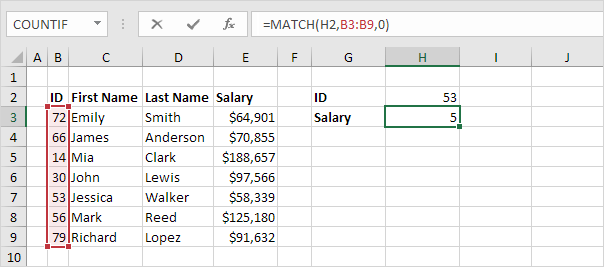
MATCH
MATCH is an Excel function used to search for a specified value within a range and return its relative position. It is valuable for tasks like index matching and data retrieval. The function has two primary parameters: the lookup value and the lookup array. MATCH returns the position of the lookup value within the lookup array. There are optional parameters for defining the match type, such as exact match or approximate match. This function is particularly useful in conjunction with other functions like INDEX to retrieve values dynamically based on specific criteria within a dataset, enhancing data analysis and manipulation capabilities in Excel.
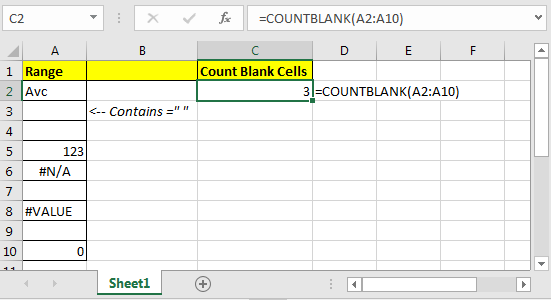
COUNTBLANK
COUNTBLANK is a function in Excel used to count the number of empty cells within a specified range. It helps users quickly identify and assess the extent of blank cells within a dataset.
To use COUNTBLANK, you provide it with a range of cells as its argument. The function then scans the specified range and counts how many cells are blank or empty. This information can be particularly useful in data analysis and quality control processes, where understanding the presence and distribution of empty cells is important.
For example, if you have a dataset containing sales figures for different months across several product categories, you can use COUNTBLANK to determine how many cells are empty, indicating missing data or gaps in your records. This can inform decisions on data cleaning, filling in missing values, or adjusting analysis methods accordingly. COUNTBLANK offers a straightforward way to assess data completeness and integrity within Excel spreadsheets.
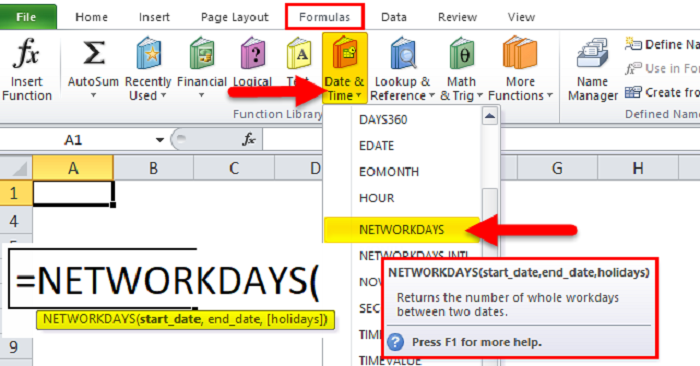
DAYS and NETWORKDAYS
In Excel, DAYS calculates the number of days between two dates, providing a straightforward method for date arithmetic. Simply input the start and end dates, and Excel computes the difference in days.
NETWORKDAYS, on the other hand, excludes weekends and specified holidays from the calculation. It's particularly useful for business scenarios where weekends and holidays shouldn't be counted toward deadlines or project durations. You can specify holidays as an optional argument. Both functions streamline date-related calculations, offering efficiency and accuracy in various contexts within Excel
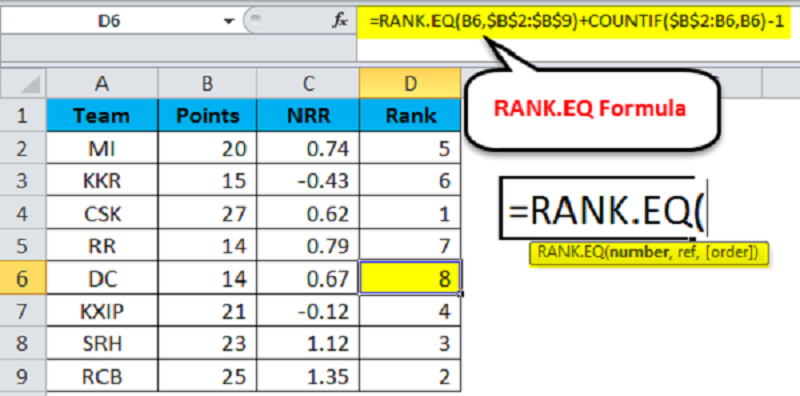
RANK
In Excel, the RANK function assigns a rank to a specified value in a dataset based on its relative position compared to other values. It helps identify the position of a value in a list or range, either in ascending or descending order. RANK can be useful for analyzing data rankings, such as sales performance, student grades, or athlete standings.
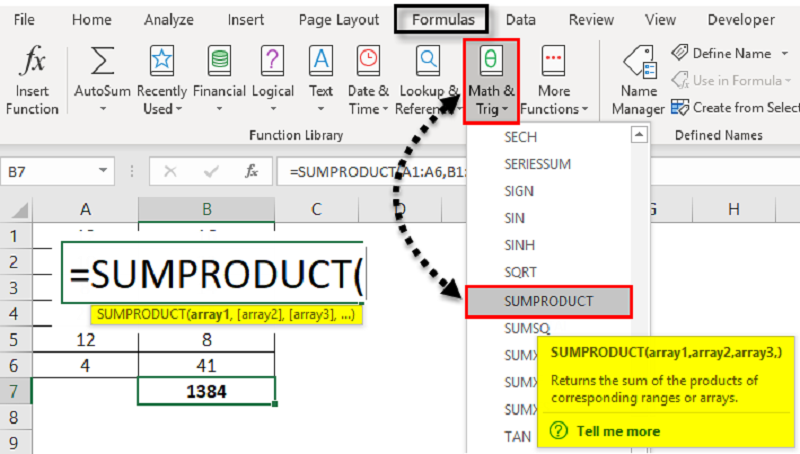
SUMPRODUCT
SUMPRODUCT is a versatile function in Excel used for multiplying corresponding elements in arrays and then summing the products. It allows users to perform complex calculations efficiently by eliminating the need for multiple intermediate steps. The function takes arrays as arguments, multiplies corresponding elements, and then adds up the results. This makes it particularly useful for calculating weighted averages, total sales amounts, and various other metrics where different factors contribute to the final result. SUMPRODUCT can handle arrays of different sizes and shapes, providing flexibility in data analysis. It's a powerful tool for performing calculations across datasets and deriving meaningful insights from numerical data in Excel.
Conclusion
Mastering the top 10 essential Excel features is paramount for data analysts. Excel serves as a cornerstone for data manipulation, analysis, and interpretation. Pivot tables and pivot charts offer dynamic ways to summarize and visualize data effectively. Conditional formatting enhances data visualization while removing duplicates maintains data integrity. Functions like XLOOKUP, IFERROR, and MATCH streamline data retrieval and error-handling tasks. COUNTBLANK helps assess data completeness, while DAYS and NETWORKDAYS simplify date calculations. RANK aids in analyzing data rankings, and SUMPRODUCT facilitates complex calculations efficiently. These features collectively empower analysts to derive meaningful insights and make informed decisions, reinforcing Excel's pivotal role in data analysis workflows.
Popular Post

- Saturday 30, 2022
Advantages of using electric scooters in India

- Monday 08, 2022
Why Cheetos are Popular in Snacks?

- Saturday 20, 2022
Why Do You Need a Financial Advisor?

- Saturday 17, 2022
Reasons Why Doritos Taste So Damn Good

- Thursday 06, 2022
5 Famous Temples in Gurugram

- Wednesday 18, 2023
What are the health benefits of Cheetos?

- Saturday 06, 2023
7 Things to Consider Before You Hire Packers and Movers in Noida


Tags