- Delhi
- Last Update 12:14: am
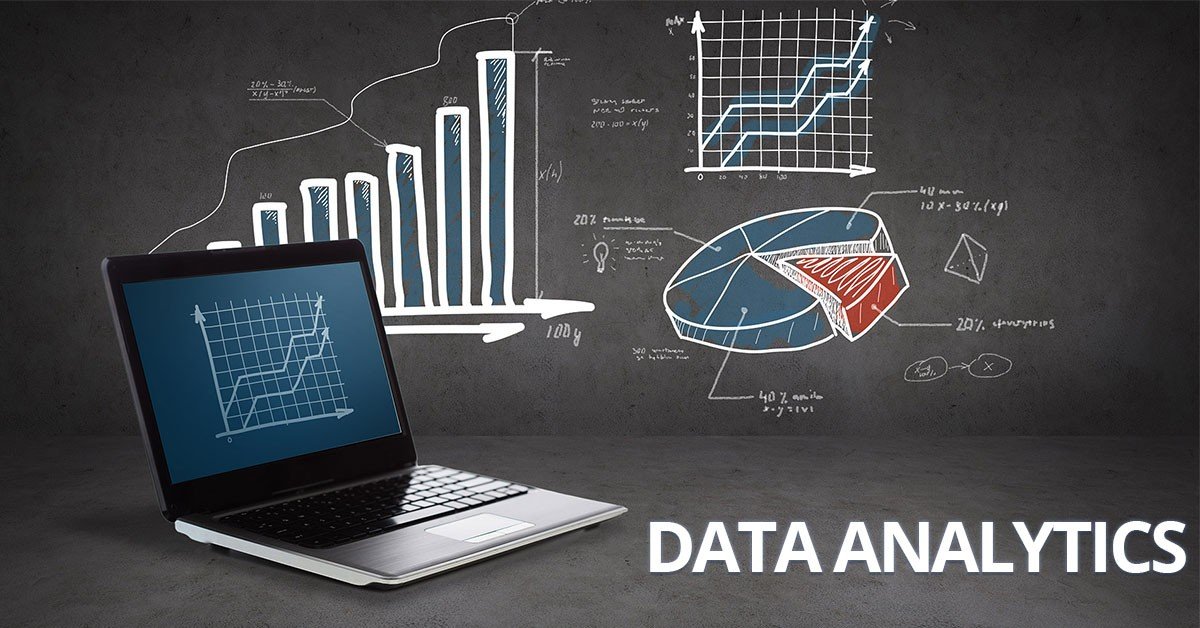
What Is Data Analytics? 2024 Beginner’s Guide
Data analytics is the process of examining large datasets to uncover insights, trends, and patterns that help businesses make informed decisions and solve complex problems effectively.
What Does Data Analytics Mean?
Data analytics refers to the process of examining large sets of data to uncover patterns, trends, correlations, and other insights. It involves collecting, cleaning, processing, and analyzing data to extract valuable information that can be used for decision-making, problem-solving, and optimizing various processes. Data analytics utilizes various techniques, algorithms, and tools to make sense of data and derive actionable insights that can drive business strategies, improve operations, enhance products or services, and achieve organizational goals.
What Are the Benefits of Data Analytics?
Informed Decision-Making: By analyzing data, organizations can make well-informed decisions backed by empirical evidence rather than relying solely on intuition or past experiences.
Improved Efficiency and Productivity: Data analytics helps identify inefficiencies, streamline processes, and optimize resource allocation, leading to improved efficiency and productivity.
Better Customer Insights: Analyzing customer data enables organizations to understand customer behavior, preferences, and needs, allowing for the development of targeted marketing strategies and personalized customer experiences.
Identification of Opportunities: Data analytics can uncover new market trends, emerging patterns, and untapped opportunities, helping businesses stay competitive and innovate.
Risk Management: By analyzing historical and real-time data, organizations can identify potential risks, anticipate challenges, and implement proactive measures to mitigate them.
Cost Reduction: Data analytics can identify cost-saving opportunities by optimizing operations, reducing waste, and minimizing inefficiencies.
Enhanced Quality Control: Analyzing data from production processes can help identify defects, errors, or anomalies early on, leading to improved quality control and product reliability.
Predictive Insights: By leveraging predictive analytics, organizations can forecast future trends, anticipate customer needs, and make proactive decisions to stay ahead of the curve.
Personalized Experiences: Data analytics enables the customization of products, services, and marketing messages to better suit individual preferences, enhancing customer satisfaction and loyalty.
Data-Driven Innovation: By leveraging insights gained from data analytics, organizations can drive innovation, develop new products or services, and adapt to changing market dynamics more effectively.
What Are the Most Common Types of Data Analytics?
Descriptive Analytics: The goal of descriptive analytics is to comprehend the past by condensing historical data. It involves organizing, cleaning, and aggregating data to generate reports, dashboards, and visualizations that provide insights into past performance and trends.
Diagnostic Analytics: Diagnostic analytics aims to understand why certain events occurred by identifying patterns and relationships within data. It involves digging deeper into historical data to uncover the root causes of specific outcomes or anomalies.
Predictive Analytics: Statistical algorithms and machine learning methods are used in predictive analytics to project future results based on past data. It leverages patterns and trends to make predictions about potential future events or behaviours.
Prescriptive Analytics: Prescriptive analytics goes beyond predicting future outcomes by recommending actions to optimize outcomes or achieve specific objectives. It involves using optimization algorithms and simulation techniques to prescribe the best course of action based on predictive insights.
Real-time Analytics: Real-time analytics involves analyzing data as it is generated or received, allowing for immediate insights and decision-making. It is particularly useful in situations where timely action is required, such as monitoring operational processes or detecting fraud in financial transactions.
What Are Some Examples of Data Analytics?
Examples of data analytics include:
Sales Analytics: Analyzing sales data to identify trends, understand customer purchasing behavior, and optimize pricing strategies.
Marketing Analytics: Using data from marketing campaigns to measure the effectiveness of different channels, segment customers, and personalize marketing efforts.
Customer Analytics: Analyzing customer data to create customer profiles, predict customer churn, and enhance customer satisfaction through personalized recommendations.
Supply Chain Analytics: Optimizing supply chain processes by analyzing inventory levels, demand forecasts, and supplier performance to reduce costs and improve efficiency.
Financial Analytics: Analyzing financial data to monitor expenses, forecast revenue, detect fraud, and assess investment opportunities.
These examples demonstrate how data analytics can be applied across various industries and functional areas to drive insights and support decision-making.
What Is the Process of Data Analytics?
The process of data analytics typically involves several key steps:
Define Objectives: The first step is to clearly define the objectives of the data analysis. This involves identifying the questions you want to answer or the problems you want to solve with the data.
Data Collection: The next stage after defining the objectives is to compile pertinent information from multiple sources. This could include internal databases, external sources, sensors, or third-party data providers.
Data Cleaning: Raw data often contains errors, missing values, or inconsistencies that need to be addressed before analysis can take place. Data cleaning involves removing duplicates, correcting errors, and filling in missing values to ensure data quality.
Data Exploration: After cleaning the data, the next step is to explore it to gain a better understanding of its characteristics and uncover initial insights. This could entail compiling the data into a summary, displaying it using graphs or charts, and spotting patterns or trends.
Data Pre-processing: Depending on the analysis techniques to be used, additional pre-processing steps may be required. This could involve transforming variables, scaling data, or encoding categorical variables to prepare the data for analysis.
Data Analysis: With the data prepared, the next step is to perform the actual analysis. This could involve applying statistical techniques, machine learning algorithms, or other analytical methods to uncover patterns, relationships, or insights in the data.
Interpretation of Results: Once the analysis is complete, the results need to be interpreted in the context of the original objectives. This involves assessing the significance of findings, drawing conclusions, and identifying implications for decision-making.
Visualization and Reporting: The findings of the analysis are often communicated through visualization tools such as charts, graphs, or dashboards. Reports or presentations may also be prepared to summarize the key findings and recommendations.
Iterative Process: Data analytics is often an iterative process, with steps such as data collection, analysis, and interpretation being revisited as needed. This allows for refinement of analysis techniques and incorporation of new data or insights over time.
What Does a Career in Data Analytics Look Like?
A career in data analytics involves analyzing large datasets to uncover insights and trends that inform business decisions. Professionals in this field use statistical techniques, programming languages, and data visualization tools to extract valuable information and drive organizational strategies.
Popular Post

- Thursday 30, 2022
All You Need To Know About Modular Kitchen Cabinet

- Thursday 07, 2022
Pros and Cons of Honeycomb Blinds

- Monday 18, 2022
Best Place To Buy Real Estate Property In Gurugram

- Saturday 30, 2022
Advantages of using electric scooters in India

- Monday 08, 2022
Why Cheetos are Popular in Snacks?

- Monday 08, 2022
Guide to Use and Care for Stainless Steel Cookware

- Monday 08, 2022
What is US CMA Course and its benefits?

- Wednesday 10, 2022
Before Investing in Gurugram, Take This Walk-through

Tags